A Senior executive came rushing out of his office and shouted at his underlings: "Has anyone seen my pencil?". "It's behind your ear" replied one of the team. "Come on!", the executive demanded " I'm a busy man! Which ear?". We've all met them. These are the people for whom web page logins are a pain. They much prefer to have a document nicely formatted and printed, and put on their desk. By combining the Chart Controls with the free PDF utility, iTextSharp, you can deliver the best of both worlds.
In previous articles, I have already covered both the Chart Controls and iTextSharp. Download instructions for both utilities are detailed in the previous articles, so I won't repeat them here.
UPDATE: The chart controls are included as a native part of ASP.NET from version 4.0 onwards, which means that you do not need to download them separately if you are using VS2010.
I will be generating a chart using LINQ to SQL to connect to the Northwind database, which is available here. In ASP.NET Web Forms, the chart controls are just that - server controls that can be dragged and dropped onto the Form Designer, and configured there. Within MVC there is no place for server controls, so we have to programme against their API instead.
The Chart controls can be rendered in a number of ways within Web Forms but ultimately generate an image that can be displayed using an <img> tag from disk, or streamed to the browser using an HttpHandler. In respect of MVC, an img tag will suffice that points to a controller action which generates the image:
<div><img src="Chart/GetChart" /></div>
And the action itself:
public FileContentResult GetChart()
{
  return File(Chart(), "image/png");
}
The action returns a FileContentResult, which is the actual image as a byte array. So the byte array needs to be generated via the Chart() method as follows:
private Byte[] Chart()
{
  var db = new NorthwindDataContext();
  var query = from o in db.Orders
              group o by o.Employee
                into g
                select new
                {
                  Employee = g.Key,
                  NoOfOrders = g.Count()
                };

  var chart = new Chart
  {
    Width = 300,
    Height = 450,
    RenderType = RenderType.ImageTag,
    AntiAliasing = AntiAliasingStyles.All,
    TextAntiAliasingQuality = TextAntiAliasingQuality.High
  };

  chart.Titles.Add("Sales By Employee");
  chart.Titles[0].Font = new Font("Arial", 16f);

  chart.ChartAreas.Add("");
  chart.ChartAreas[0].AxisX.Title = "Employee";
  chart.ChartAreas[0].AxisY.Title = "Sales";
  chart.ChartAreas[0].AxisX.TitleFont = new Font("Arial", 12f);
  chart.ChartAreas[0].AxisY.TitleFont = new Font("Arial", 12f);
  chart.ChartAreas[0].AxisX.LabelStyle.Font = new Font("Arial", 10f);
  chart.ChartAreas[0].AxisX.LabelStyle.Angle = -90;
  chart.ChartAreas[0].BackColor = Color.White;

  chart.Series.Add("");
  chart.Series[0].ChartType = SeriesChartType.Column;

  foreach (var q in query)
  {
    var Name = q.Employee.FirstName + ' ' + q.Employee.LastName;
    chart.Series[0].Points.AddXY(Name, Convert.ToDouble(q.NoOfOrders));
  }
  using (var chartimage = new MemoryStream())
  {
    chart.SaveImage(chartimage, ChartImageFormat.Png);
    return chartimage.GetBuffer();
  }
}
I've put this in the Controller, hence the fact that the method is private. The LINQ query returns an anonymous type which contains Employee objects together with the total number of orders they have each generated. A Chart object is instantiated and some properties are set for rendering, including some fonts and labels. The resulting data from the LINQ query is bound to the chart using the AddXY() method. The chart is then saved to a MemoryStream object and then returned as an array of bytes. From there, it is displayed on the page:
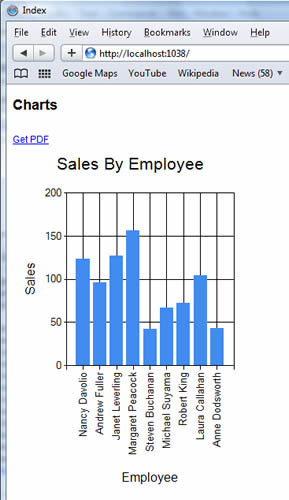
The link displayed in the image above to "Get PDF" is generated by the following html:
<div><a href="Chart/GetPdf">Get PDF</a></div>
Using the same principal as with the Chart, the hyperlink points to a controller action: GetPdf():
public FilePathResult GetPdf()
{
  var doc = new Document();
  var pdf = Server.MapPath("PDF/Chart.pdf");

  PdfWriter.GetInstance(doc, new FileStream(pdf, FileMode.Create));
  doc.Open();

  doc.Add(new Paragraph("Dashboard"));
  var image = Image.GetInstance(Chart());
  image.ScalePercent(75f);
  doc.Add(image);
  doc.Close();

  return File(pdf, "application/pdf", "Chart.pdf");
}
This action is very simple if you already have some familiarity with iTextSharp. If not, refer to the first in my iTextSharp series of articles, together with the article that covers working with images. The action creates a new iTextSharp Document object. A paragraph is added that simply says "Dashboard", and then the same byte array generated by the Chart() method is passed to an iTextsharp.itext.Image object. This is then reduced to 75 percent of its original size and added to the document. The Document.Close() method saves the resulting file to the location specified in the initial PdfWriter.GetInstance() call, and then it is returned through a FilePathResult class. Clicking the link generates an Open or Save dialogue box, and the complete PDF file:
A quick word about the usings that appear at the top of the controller code:
using System;
using System.IO;
using System.Linq;
using System.Web.Mvc;
using System.Web.UI.DataVisualization.Charting;
using iTextSharp.text;
using iTextSharp.text.pdf;
using PDFCharting.Models;
using Color = System.Drawing.Color;
using Font = System.Drawing.Font;
System.Web.UI.DataVisualization.Charting is needed so that you can work with Chart objects. PDFCharting.Models references the Models area of the application which contains the LINQ to SQL classes, and the final two references are there to avoid namespace clashes. There are a number of objects within the iTextSharp component which are named the same as commonly found .Net classes, such as Image and Font. Typically, to avoid the compiler complaining of ambiguity, you might use the fully referenced class name in code. For example, System.Drawing.Font. However, as an alternative, I have provided a namespace alias so that I can reference .NET classes without having to add the fully qualified name.
Summary
We have seen that Charts are generated as images, and used two different derivatives of ActionResult to deliver them: FileContentResult to stream the binary content directly to the browser, and FilePathResult to return a file saved to disk. In addition, we learned the basics of binding a LINQ query result to the data points on a Chart. We have also seen how to add a byte array as an image to an iTextSharp PDF document, and finally learnt a bit about namespace aliases.
This is a very simple example that is intended just to illustrate a starting point. The Chart() method should not normally appear within the controller itself, even as a private method. Not unless your application is very simple. From the point of view of maintainability and extensibility, you might find K Scott Allen's ChartBuilder class a good place to start in terms of separating the grunt work into its own area. If you are feeling really adventurous, there is no reason why you couldn't use the concepts presented in the ChartBuilder class to create a similar utility for building PDF files.
