This information is accumulated from a number of blogs, chief among them that of Mikhail Arkhipov.
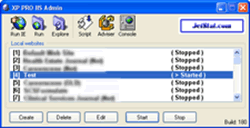
IIS 5.1 on XP Pro doesn't support multiple web sites by default. So the first thing I did some time ago was to download IISAdmin from JetStat which, while it still only allows one site to run on the server at any one time, permits you to create multiple sites. This is fantastic, as it allows you to create site structures that will mirror the hosting environment, and negates the need to run individual projects by adding the folder name to the http://localhost url. Now to add debugging.
- First, use IISAdmin to Start the site you want to debug
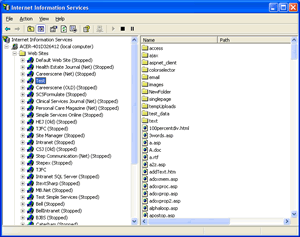
- Then click on Console to bring up the IIS Management tool and go to the properties of the selected site
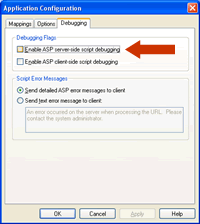
- Click the Configuration button on the Home Directory tab and then make sure that "Enable ASP server-side script debugging" is selected (ticked) on the Debugging tab
- Open the site from within VS, and set breakpoints in the page you want to debug.
- Open a browser and browse to the page.
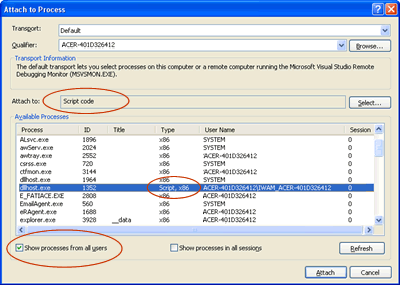
- Back in VS, click the Debug menu, and select "Attach to Process..."
- Make sure that the "Attach to..." option says "Script". If it doesn't, click the "Select.." button and choose "Script"
- Look in the list of processes for dllhost.exe. If it is not there, check "Show processes from all users" If there is more than one entry for dllhost.exe, select the one that has a "Type" entry for "Script, x86". Just to be doubly sure, this should be the entry running under the machinename/IWAM_machinename user. Select this entry and click "Attach". You should get a warning dialogue. Read it and click "Attach" anyway.
- Now go back to the browser, and re-run the page. Debugging should start.


Troubleshooting
If your breakpoints fail to get hit, double check that you have enabled ASP server-side script debugging for the site (Step 1).
If no breakpoint is hit, and the breakpoint markers change from a deep red and hovering over them produces a tool tip saying: 'The breakpoint will not currently be hit, no symbols have been loaded for this document', check that the Attach to... option is Script (Step 7).
